Introduction
In this Visual Calculator for SansGUI utility program, we use network flow diagrams to represent mathematical expressions. In order to show you how to use it, we have four pilot Project Models listed in the following to get you started. It is recommended that you come back to this page after going through the examples. There is a link at the end of each example to lead you back to this page.
Once you've learned what Visual Calculator is and what you can do with it, let's create a very simple Project Model that calculates C = A / (B + 3) from scratch. We assume that you have gone through A Tour of SansGUI Examples in the SansGUI Getting Started guide and know some basic user operations in the SansGUI Run-Time Environment.
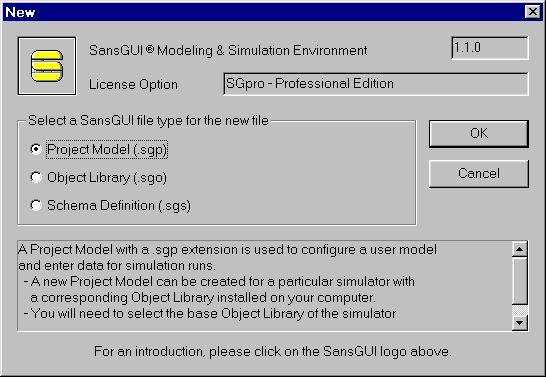
First we need to create a new Project Model. Use the File>New menu and select Project Model (.sgp) from the available SansGUI file types. The figure below shows the enhanced New dialog from SansGUI version 1.1. You can select a file type and read the descriptions of the type at the bottom of the dialog. If you would like to read the introduction section of the SansGUI Manual, you can click on the SansGUI Icon at the upper left corner of the dialog. In fact, this big icon button in any Properties dialog is your key to most on-line, context-sensitive manual pages.
If you only have the SansGUI Run-Time Edition, the Schema Definition (.sgs) item will be disabled in the selection items. For now, make sure that the Project Model (.sgp) is selected and click on the OK button to continue. A Project Model [Create] dialog appears as following:
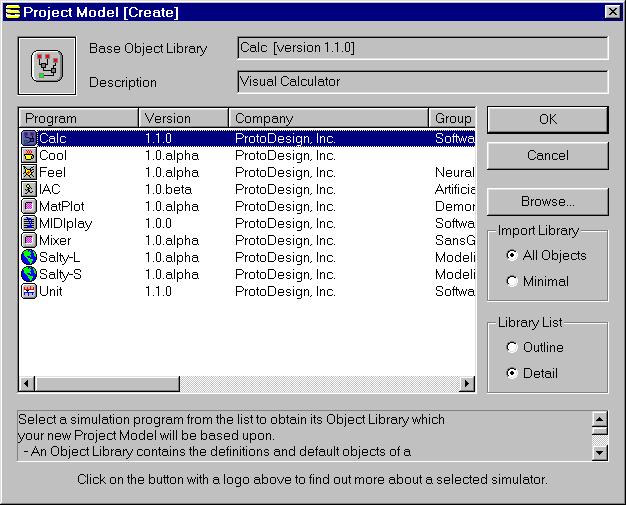
You will find a list of installed simulators in the dialog. If you see Program Calc, click on it to select it; otherwise, use the Browse... button to find the Calc_1_1.sgo file from the Samples\Calc directory. The selected Object Library is displayed in the Base Object Library and Description fields and the icon button is changed to reflect the selection. At this moment, you can click on the icon button to get on-line help on Calc.
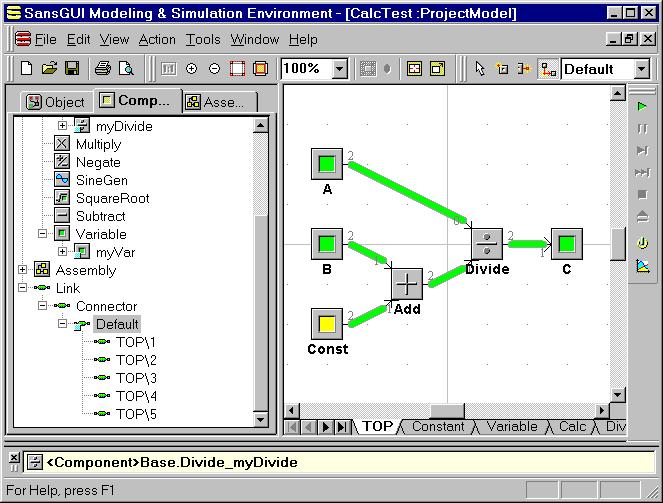
Click on the OK button to accept the selection and close the Project Model [Create] dialog. A new Project Model is created and displayed with an empty Canvas View for the TOP assembly of the model, as shown in the following figure. If the contents under the Component tab (the middle tab) in the Left Pane is not shown, click on the tab to reveal it, as demonstrated in the following figure.
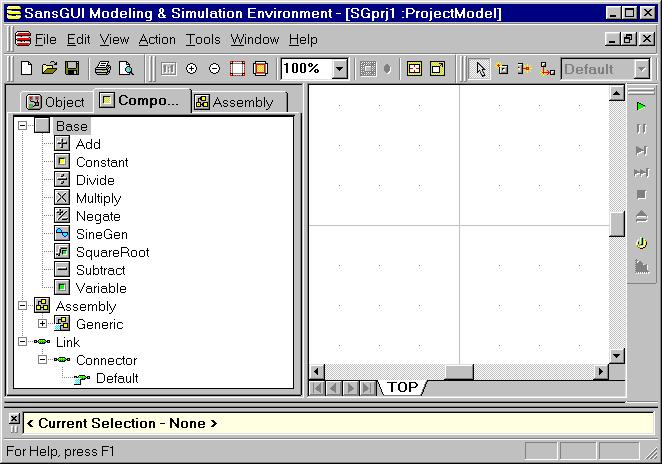
Because SansGUI uses the Class-Object-Part paradigm to simplify the creation of multiple similar components, we need to create objects before placing parts into the Canvas View. You don't need to create all the objects before starting to create any part. The only constraint is that a part can be created by placing it into the Canvas View when the object it will be derived from has been created and selected into the Object Toolbox at the bottom of the SansGUI window. Initially, the Object Toolbox may display < Current Selection - None > as in the above figure.
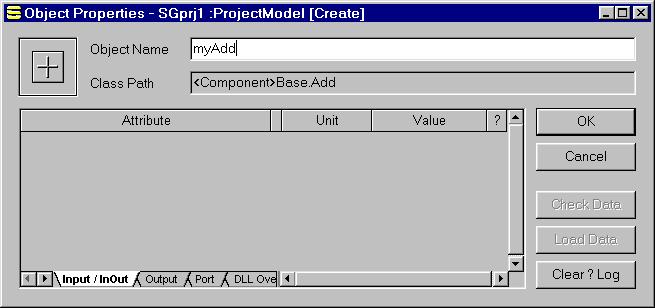
Right click on class Add or its icon and select Create/Clone Object from the context menu. An Object Properties dialog appears. Enter myAdd in the Object Name field and press the <Enter> key or click on the OK button to create it.
Use the same procedure to create a myDivide object from the Divide class. We also create an object myVar by applying the same procedure and derived it from the Base.Variable class. There is, however, a class attribute shown in the Object Properties dialog:
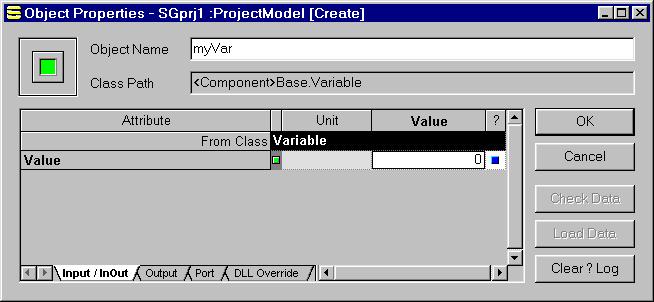
The initial value is set to 0. The column with a question mark ? is for the log flag of the attribute. When there is a small blue square in it (as shown in the above figure), the values will be logged in the Result View during simulation runs. If you don't see the blue square, simply click on the center of the cell to turn it on. Click on the OK button to create the new object and close the dialog.
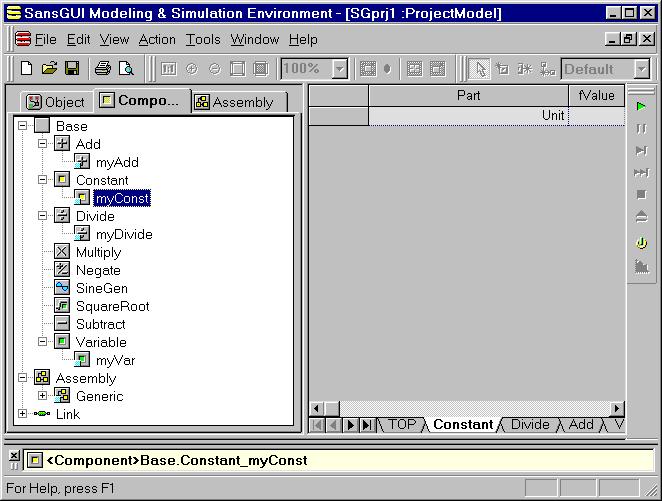
Create a new myConst object from the Constant class, using the same procedure as creating myVar above. Make sure to turn on the log flag. The SansGUI window should look similar to the following:
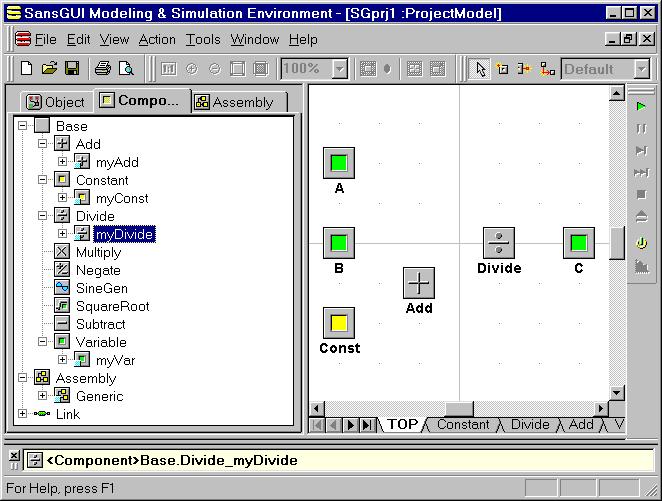
Parts are the instances of objects created in Canvas Views. To create parts in the TOP assembly, first click on the TOP tab in the Right Pane to reveal the drawing canvas of the TOP assembly. Perform the following to create all the parts for this project, as show in the following figure:
If the Build toolbar (the one containing the arrow Select button) is dimmed, click on any empty area of the Canvas View once to turn them into color buttons.
Click on the New Part button to the right of the Select button.
Click on the myVar object in the Left Pane to see it being selected in the Object Toolbox as in the bottom of the previous figure.
Move your mouse pointer to the position where part A is shown in the previous figure. The mouse pointer will be turned into a cross (+) in the Canvas View.
Click on the empty spot, a new part derived from myVar is created.
Double click on the newly created part to open its Part Properties dialog and change the part name to A, from an automatically generated number.
While the myVar object is selected in the Object Toolbox in the bottom of the SansGUI Window, create parts B and C by clicking on the empty spots approximately in the same positions as those in the above figure. Change their automatically generated names to B and C, as in the procedures of creating part A. The Tree View in the Left Pane works like a palette of component objects. When you click on one of the component, the object is selected into the Object Toolbox in the bottom of the SansGUI window. You can use it to create multiple parts derived from the same selected component object with subsequent mouse clicks in the Canvas View.
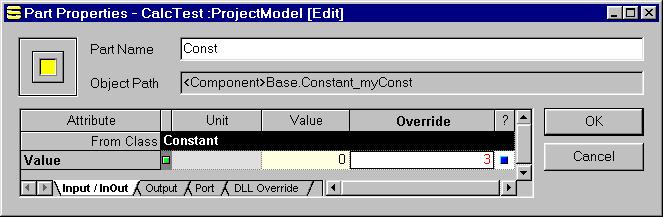
Select the myConst object from the Left Pane and create the Const part in the Canvas View. When you are in its Properties dialog, enter the value 3 in the Override column of the Value field, as shown below. The value is displayed in red, meaning that it is a part override value.
Select the myAdd object from the Left Pane and create the Add part in the Canvas View.
Select the myDivide object from the Left Pane and create the Divide part in the Canvas View.
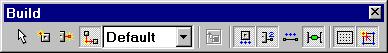
Once the needed parts have been created, we can connect them with links to model the relationships among the operators and operands in the equation. To create new links, click on the New Link button, shown as the third button to the right of the arrow Select button in the Build toolbar in the following figure:
Let's construct the B + 3 (Const) portion of the equation first, and then send the result to the Divide operator as a divisor:
Click on a point inside part B, preferably close to the center of the right edge of part B's icon. A port is created outside part B near the point you just clicked.
Move the mouse pointer around and you can see a rubberband line being displayed to show the target link. At this moment, click on the upper left corner of part Add to complete the link.
The link may be shown as a thin black line, you can toggle it to display as a thick green line (as shown in the figure) by clicking on the Link Value button, which is the third from right, in the Build toolbar (shown below). The Link Value button is not shown in the above figure because the SansGUI window size is too small. You can see it on your computer screen by making the SansGUI window bigger, or drag the Build toolbar to let it float in the window area.
Do the same to create a link from the Const part to part Add.
Also, create a link from part Add to part Divide.
The input link to part Divide needs a little attention because of the semantics of the division operator. Unlike those connected to an addition operator, the inputs to a division operator are not symmetrical. That is, there are distinct differences between a dividend and a divisor. In Visual Calculator for SansGUI, we allow one dividend and multiple divisors to be linked as inputs to a division operator. To identify these inputs, we use the port numbers in the division operator -- a unique port number 0 is dedicated to the dividend and all other inputs connected to the non-unique port number 1 as divisors. You can examine the port number and change this automatically generated number by:
Click on the arrow Select button in the Build toolbar.
Click on any point in the link to select it. The selected link will be highlighted with its control knobs displayed.
Move the mouse pointer to the control knob closest to part Divide. The cursor will be changed to an arrow pointing up.
While the cursor is an up arrow, double click on it to obtain a Port Properties dialog.
If the Port@ field shows 0, change it to 1 so that the input can be treated as a divisor.
Click on the OK button to commit the change and close the dialog.
To complete the connections in the model, perform the following in the Canvas View:
Create a link to connect part A to part Divide. If the port number is not 0, use the procedure above to invoke the Port Properties dialog and change the Port@ field to 0. With this port number, the value in part A will be treated as the dividend in the division operation.
Create a link to connect part Divide to part C.
With the equation model built, we need to specify the evaluation order to conform to the mathematical precedence. The default evaluation order in SansGUI cycle simulation control is by name. If you don't change the order, part Add will be evaluated before parts B and Const; therefore, the addition operator in part Add cannot obtain correct values for the operation. Because we built the model in a left to right orientation, we use the Vertical Scanline method in the Part Evaluation Order simulation control attribute. This method has imaginary vertical scanlines from the top of the canvas to the bottom, scanning from the left side of the canvas over to the right. With vertical scanlines, the parts are evaluated in the sequence of A, B, Const, Add, Divide, and C in this model.
To modify the Part Evaluation Order, perform the following:
Click on the first Object tab in the Left Pane.
Locate the Default object (with a little light blue square at the lower left corner of its icon) under the SimControl.Cycle.Calc class.
Double click on the Default object name or its icon to obtain its Object Properties dialog. You can also select Properties from the right click context menu.
The Part Evaluation Order attribute contains a drop-down list. When you click on its Value field, you will see a list of choices. Select Vertical Scanline.
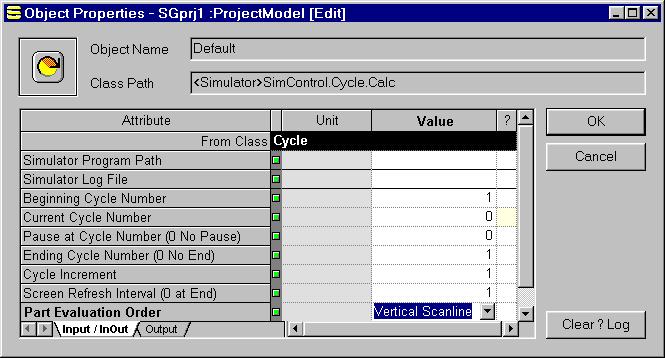
When calculating C = A / (B + C), we only need to run the simulation with a single cycle. In Visual Calculator for SansGUI, the project models requiring multiple cycles are those containing loops (Example 3) or involving the sine wave generator (Example 4). In this case, we let both the Beginning Cycle Number and the Ending Cycle Number be 1 before a simulation run. SansGUI will run 1 cycle and update the Current Cycle Number by the value specified in the Cycle Increment attribute. Once the Current Cycle Number goes beyond the Ending Cycle Number, the simulation stops. You don't need to reset the Current Cycle Number, SansGUI will always initialize it to the Beginning Cycle Number when you start a cycle simulation.
The other important thing you need to be aware of before running a simulation is to log data values of certain attributes. We have done this when specifying the objects myVar and myConst. All the parts created from these objects subsequently inherit the log flag settings in the Variable Value attribute. Starting from SansGUI 1.1, you can view all the logged attributes in the Result View in the Bottom Pane at any time. If the value attributes are not shown in the Result View, you can double click on the A, B, C, or Const parts in either the Canvas View or the Tree View to obtain their Part Properties dialog and set the log flags.
The easiest way to enter the values in A and B is to use the Grid View of class Variable parts in the Right Pane. From the Component tab, locate the Base.Variable class and click on the class name or its icon. A Grid View for all the parts derived from the Base.Variable class will be shown in the Right Pane. You can enter the values directly for A and B. In this case, we entered 25 and 7 for A and B, respectively. The value in C, as shown below, contains the calculated result after a simulation run.
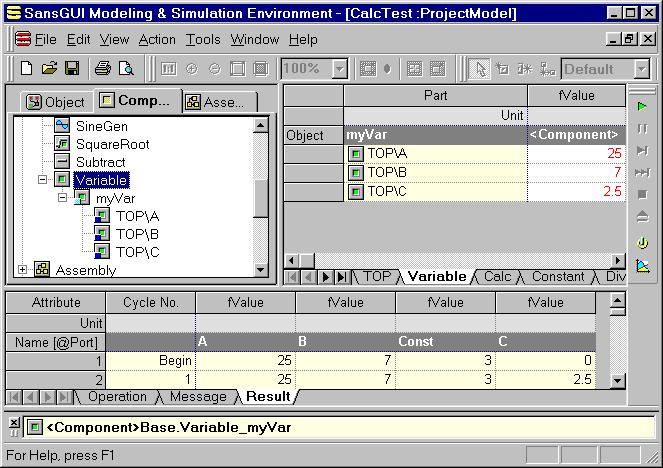
Run the simulation by clicking on the Run In-Process button in the Run toolbar, which contains buttons similar to the VCR/DVD control buttons. The Run In-Process button contains a triangle pointing to the right, as if it were the play button in the VCR/DVD control panel. When you click on the Run In-Process button, the Operation View in the Bottom Pane will be revealed to show the progress of the simulation. You can switch to the Result View to see the logged values, as shown in the above figure.
If you receive a divided-by-zero error reported by the Divide operator, the Part Evaluation Order in the Default cycle simulation control object may not be set to Vertical Scanline method. Please go back to the Examining Simulation Control Object section above to correct it.
If you obtain a value 0.4 in D, it means that the dividend and divisor has been swapped in the input ports of part Divide. Please go back to the Linking Parts section above to correct it.
If you obtain a wrong result for the value of D, please examine the values in A, B, and Const. Because A and B are derived from the Variable class, their values are wiped off when you click on the Reset Data button. If the answer shows 0 in D, you may have 0 in both A and B. In this case, you need to enter the values of A and B before running it again.
As you can see in the Result View, the logged attributes contain only data values for one cycle in this example. Therefore, data plotting from this limited set is not quite interesting. More interesting charting is involved with models that are executed with multiple simulation cycles, such as those contain loops (Example 3), or involve with sine wave generation (Example 4). Please consult SansGUI User's Guide for how to associate attributes with X and Y axis, and plot results.
Advanced users may want to modify some of the class functions in the Visual Calculator for SansGUI. For example, you may supply an enhanced code for custom sine wave generation to replace the one from the distribution. You can do so via SansGUI's class function overriding feature in the Run-Time Environment. Yes, you only need the SansGUI Run-Time environment to specify the overriding routines created in a dynamic link library (DLL) for execution. The SansGUI Development Environment is needed when you wish to change the class schemas, such as adding or deleting attributes or creating new classes of your own.
Please consult Chapter 6 Overriding Simulator Routines of the SansGUI User's Guide for details.
|
Icon |
Class |
Description |
|
|
Class to implement the addition arithmetic operator. | |
|
|
Class to implement the subtraction arithmetic operator. | |
|
|
Class to implement the multiplication arithmetic operator. | |
|
|
Class to implement the division arithmetic operator. | |
|
|
Class to implement the negation operator. | |
|
|
Class to implement the square root function. | |
|
|
Class to implement a sine wave generation function. | |
|
|
Class to allow values to be initialized for processing. | |
|
|
Class to allow values to be stored for processing. | |
|
|
Simulation control class containing run-time parameters. | |
|
|
Link component class for connecting two parts. |
Visual Calculator for SansGUI Version 1.1
Copyright © 2001-2003 ProtoDesign, Inc. All rights reserved.